
Private equity-backed CargoSprint adds Dray Dog to its quiver
The private equity-backed freight payment platform provider CargoSprint has acquired Dray Dog, a port drayage software platform, saying the move expands its landside execution capabilities and deepens its commitment to motor carriers.Founded in 2012, Atlanta-based CargoSprint says it enhances efficiency in cargo operations, with a focus on the “middle mile.” It offers its flagship products—SprintPay, SprintPass, and eModal—to users such as freight forwarders, third-party logistics providers, cargo facilities, and transportation providers.In 2024, the private equity firm Lone View Capital acquired a majority ownership stake in the company. And a month later, CargoSprint acquired Advent Intermodal Solutions LLC, whose cloud-based eModal platform makes it easier for ports, carriers, logistics providers and other stakeholders to move containers, increase equipment utilization, and optimize payment workflows.Adding New Hampshire-based Dray Dog now extends CargoSprint’s services for motor carriers and independent owner-operators, the firm said. CargoSprint said it plans to further invest in Dray Dog’s product and team, leaning into its mission to improve decision-making and support operational outcomes that matter to drayage operators — such as fewer preventable re-drives, tighter planning, and better alignment between dispatch capacity and appointments.Terms of the deal were not disclosed.

10 Warehousing & Distribution Trends Reshaping Operations in 2026
Warehousing Transforms Into Strategic Growth Engine Distribution centers have moved from cost centers to customer-facing profit drivers, forcing firms to re-engineer every workflow for speed, accuracy, and transparency. Analytics Replace Instinct in Daily Operations Warehouse managers who once relied on clipboards and gut calls now start each shift reviewing forecast-confidence scores, labor-heat maps, and dynamic slotting suggestions. Facilities that feed verified upstream data into these models cut operating costs 25-30% while raising accuracy to 99%, according to a 2026 WERC benchmark. The competitive edge is no longer the dashboard itself, but the discipline to challenge dirty data before it masquerades as insight. Leaders are therefore hiring “data auditors” who trace discrepancies back to the moment a purchase order was keyed, preventing the false precision that can send pickers down empty aisles. In Reno, Nevada, for instance, one 1.2 million-square-foot site eliminated 1,800 picking miles per month after auditors discovered that carton dimensions in the master file were off by two inches. Critics argue the fix was small, yet the ripple cut overtime by 12%. Predictive Models Move From Pilots to Core Workflows After years of small-scale trials, machine-learning engines now set daily headcount targets, flag pallets likely to arrive late, and re-slot fast-moving SKUs before demand spikes. A current Gartner poll shows 77% of supply-chain teams embedding predictive logic into at least three operational workflows this year, up from 34% in 2023. The lesson from early adopters: start with a single bottleneck—such as a congested staging lane—measure baseline throughput for eight weeks, then fund the algorithm only if it beats human schedulers by more than 6%. Targeted deployments beat broad-brush “big-data” projects four to one on payback speed. Full-Chain Visibility Becomes Table Stakes Customers checking a mobile app now expect the same granularity on a carton crossing the dock as on an Uber en-route to their door. Cloud portals that stitch together supplier ASN messages, inbound carrier GPS pings, WMS task files, and outbound TMS scans have become the default architecture of the $1.8 trillion global 3PL market. When any node goes dark—say, a trailer yard that still logs arrivals on paper—inventory buffers swell an average of 12% to protect against the unknown, erasing margin. Executives report that end-to-end platforms pay for themselves primarily by shrinking that “fear inventory.” Automation Dollars Flow to Proven Bottlenecks Capital budgets are shifting away from lights-out fantasies toward surgical fixes: AMRs that relieve pick congestion at one mezzanine corner, cobots that stack the heaviest cases, or vision systems that catch shipping-label errors before cartons reach the sorter. Installations hit 4.7 million robots across 50,000 sites last year, yet most follow a cookie-cutter ROI script: eight-month payback, 42% five-year OPEX reduction, and failure-mode documentation that maintenance teams helped write. The fastest-growing financing vehicle is Robotics-as-a-Service, converting CapEx into per-pick fees that rise or fall with seasonal volume. Workforce Sustainability Enters KPI Dashboards Turnover no longer tracks hiring velocity alone; it is now linked to ergonomic scores, schedule predictability, and “technology friction” logged by associates. An Intermec survey shows 89% of workers in mechanized sites report higher satisfaction, largely because automation stripped the longest walks and heaviest lifts from their day. Conversely, facilities that add screens without relieving physical strain saw fatigue-related errors jump 8%. Best-in-class programs cross-train employees on bots, scanners, and exception handling, creating relief teams that can redeploy in minutes when a conveyor jams. Resilience Planning Turns From Slide Decks to Playbooks Boards burned by the 2024 Red Sea diversions now demand pre-positioned alternatives for every critical lane. Seventy-five percent of large shippers run quarterly stress tests that model simultaneous port closures, carrier strikes, or cyber lockdowns, then pre-negotiate overflow space with 3PLs in secondary markets. The exercise is treated like a fire drill: pick lanes, labor pools, and cross-dock doors are reserved on paper, and contracts include “activation fees” that lock in rates when the trigger is pulled. Firms that rehearsed at least once last year restored 94% of throughput within 72 hours of a disruption, versus 61% for those with static contingency binders. Useful ResourcesWERC Annual Benchmarking Guide – free PDF with 200+ warehousing metricsRIA Robotics Cost Calculator – spreadsheet that models CapEx vs. RaaS for AMRsMIT Sustainable Supply Chain Lab – open data sets on carbon per carton by transport modeCSCMP Supply Chain Process Standards – templates for documenting resilience playbooksMHI Career Portal – curriculum outlines for warehouse technology coordinator roles
A. Duie Pyle to build warehouse and LTL hub near Port of Virginia
Transportation and supply chain solution provider A. Duie Pyle today said it has broken ground on an integrated logistics campus designed to support warehouse operations, less than truckload (LTL) cross-dock services, and transloading moves in the Norfolk region, specifically serving the Port of Virginia.The company purchased the 43-acre site in Suffolk, Virginia, from Rockefeller Group and Matan Companies, which operate a planned logistics facility called Port 460. Pyle now plans to build a 52-door LTL cross-dock and 200,000 square feet of warehouse (expandable to 420,000 square feet) under one roof, with an estimated completion date of Q2 2027.According to Pyle, that approach will enable its customers to benefit from a more integrated solution that combines storage, transportation, and immediate access to Pyle’s final-mile network. Service offerings will include warehousing and distribution, transloading, LTL, contract dedicated services, drayage, and truckload management brokerage services.“Our expansion in the Suffolk–Norfolk market reflects a strategic response to the rapidly evolving demands of today’s supply chain,” said Frank Granieri, Chief Commercial Officer at A. Duie Pyle. “In recent years, shippers have navigated unprecedented disruptions, elevating the need for speed, resilience and adaptability across their networks. By establishing this integrated warehouse and LTL service center near the Port of Virginia, we’re not just enhancing our capacity; we’re addressing the pressing need for more efficient, adaptive solutions that streamline operations in a high-demand market.”

EV charging infrastructure is not keeping up with driver demand
Despite decreased incentives and regulations over the past year for U.S. drivers to purchase electric vehicles (EVs), charging infrastructure is still not keeping up with driver demand, according to a report from charging solution provider ChargePoint.The number of EVs on the road is growing faster than the charging infrastructure needed to support them, the California-based firm said.Whether charging demand is evaluated by volume or utilization, the data shows that charging sessions are outpacing new charger installation. In 2025, the volume of charging sessions increased by 34%, despite a much smaller increase in the number of vehicles on the road. Even with 190,000 more charging ports becoming available to drivers on the ChargePoint network, charger utilization still outpaced the growth of new ports by almost 20%.“ChargePoint believes we have entered the next phase of EV adoption. Nearly 60% of the 19.3 billion electric miles we’ve enabled in nearly 18 years took place over the most recent two years,” ChargePoint CEO Rick Wilmer said in a release. “New EV sales are no longer the primary benchmark for charger demand, it is the total number of EVs on the road. Those installing chargers in 2026 should see accelerated ROI because of this utilization pressure.”ChargePoint says its network currently gives EV drivers access to more than 900,000 roaming ports in addition to approximately 375,000 public and private ports that ChargePoint directly manages.

8-Point Checklist for Choosing a Third-Party Warehousing Partner
Vacancy rate at 4.5 % pushes fast-growing firms to screen third-party warehouses on eight hard metrics before peak seasonTight market raises stakes for provider selectionOnly 4.5 % of Class-A industrial space is empty in major U.S. markets, and e-commerce tenants are signing leases 2.5 times faster than traditional retailers. The wrong choice now costs more than a few cents per pallet: overflow to backup buildings can add 8-12 % to parcel shipping cost and shrink one-day delivery zones. After auditing 120 North American facilities, analysts distilled eight quantitative filters that separate scalable operators from brokers reselling legacy sheds.Verify cubic space, temperature control, and hazmat paperworkStart each walk-through by matching clear height to usable stack space; a 36-ft roof means little if sprinklers and conveyors eat 8 ft. Ask for 12 months of temperature logs inside any chilled chamber—deviations beyond ±2 °F for more than 15 minutes flag weak HVAC redundancy. For hazmat, request the EPA ID number and the latest Form 8700-22 submission; lapsed reports can quarantine inventory for weeks. Map drive time to the nearest highway interchange, rail ramp, and air cargo gate; every extra mile adds about $0.42 per pallet when fuel surcharges reset.Confirm bonded status and customs recordA bonded warehouse can postpone duty payments up to five years, yet barely 3 % of U.S. 3PLs hold both bonded and Foreign-Trade Zone status under one roof. Inspect the provider’s ABI filer code and run a free CBP penalty search—repeat fines above $10 k rarely appear in pitch decks. Demand a sample entry summary for your product’s tariff number; mis-classifications of just 1-5 % of shipment value can erase the savings from a lower storage rate. Make sure the WMS exports FTZ admission reports in ACE format; manual uploads add 24-48 hours and wipe out working-capital gains.Test technology stack for live data and low latencyCloud-native WMS built on micro-services can onboard a new tenant in under 48 hours, while legacy client-server systems still need on-premise terminals and VPN tunnels. Hit the provider’s API with a simple POST: latency above 300 ms signals servers already struggling to keep up with high-velocity OMS queries. Confirm that RFID or barcode scans update dashboards without overnight batching; inventory variance above 0.5 % usually traces to delayed uploads, not physical shrink. Providers using predictive analytics—flagging SKUs that will hit safety-stock limits within two weeks—cut stock-outs by 18 %.Demand full cost worksheet and benchmark SLAsAsk for a 24-month accrual sheet showing base rate, pallet-in/pallet-out fee, stretch-wrap upcharge, and peak-season surcharge; hidden accessorials can inflate the quoted rate by 14-28 %. Benchmark service-level agreements against 2026 top-quartile figures: order-fill accuracy ≥ 99.5 %, on-time shipping ≥ 98 %, dock-to-stock ≤ 24 hours, inventory shrink ≤ 0.3 %. Require monthly governance calls with root-cause logs; providers that withhold corrective-action trackers typically relapse the next quarter. Insert a 30-day pilot clause that converts to an annual contract only if all KPIs stay green through a 200-400 % volume surge.Plan for 2026 capacity and new sustainability rulesRoughly 293 active FTZ sites and solar-equipped rooftops are shifting from "nice-to-have" to procurement must-haves as SEC climate-disclosure rules reach corporate scorecards. Providers that pre-install 1 MW+ PV arrays cut tenant overhead 6-9 % through lower utility pass-throughs and shared carbon credits. Meanwhile, unified WMS-TMS-OMS platforms are collapsing onto single databases, ending the hourly batch reconciliations that once delayed customer alerts. Early adopters of electric forklifts and LED motion lighting already quote 3-5 % lower total cost of ownership when three-year electricity savings are netted against rent, a gap expected to widen as diesel taxes rise in 14 states next year.Action stepsBuild a weighted scorecard: infrastructure 25 %, technology 20 %, compliance 15 %, scalability 15 %, cost 15 %, SLAs 10 %. Schedule site visits during the provider’s historical peak week; watch live shift staffing and yard congestion. Run a 30-90-day pilot with up to 10 % of annual volume before signing a multi-year deal. Audit customs brokerage licenses, CBP penalty history, and FTZ authority through public databases. Model total cost of ownership—accessorials, inventory carrying cost, and duty-deferral benefits—before final award.Useful ResourcesU.S. Foreign-Trade Zones Board Interactive Map – Locate active FTZ sites and grantee contacts by port of entry CBP Penalty Search Portal – Free public tool to verify a broker’s enforcement history WERC Annual DC Metrics Report – Benchmark warehouse KPIs against industry quartiles LEED Warehousing Project Directory – Identify providers whose buildings meet carbon-reduction criteriaSource: Logistics Management
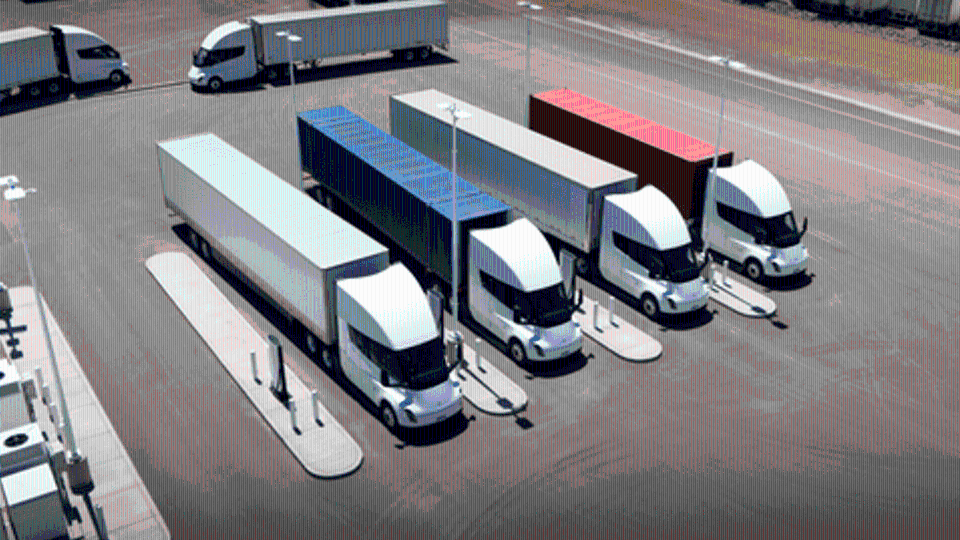
Tesla to install battery chargers at some Pilot truckstops to support Tesla Semi
After Tesla recently shared plans to ramp up for volume production of its Tesla Semi battery electric truck in 2026, the company has now announced a deal to install specialized battery charging stations at certain locations of the Pilot Travel Centers truck stop network.To keep those new electric trucks running, Tesla said it would provide Semi Chargers to facilitate heavy-duty electric vehicle truck charging. Expected to open in Summer 2026, the Tesla charging stations will be built at select Pilot locations along I-5, I-10, and “several major corridors where the need for heavy-duty charging is highest,” the companies said.Specifically, construction of the charging stations will begin in the first half of 2026 at sites across California, Georgia, Nevada, New Mexico and Texas. Pilot travel centers equipped with Tesla Semi Chargers will host four to eight charging stalls and will use Tesla’s V4 cabinet charging technology, delivering up to 1.2 megawatts of power at each stall.This network will initially focus on providing charging infrastructure only for Tesla’s Semi trucks, but it may be expanded in the future to be compatible with heavy-duty electric vehicles from other manufacturers.By building the units at truck stops, Tesla says it is matching the technology’s need for long charging sessions with drivers’ regulated resting time. That’s because the majority of a Semi truck’s 500-mile range can be recovered in a 30-minute charge session, matching a normal mandated break period for professional drivers, Tesla says.The expansion of the charging infrastructure comes at a time when analysts predict that electric vehicle (EV) sales growth in the U.S. is on track to shrink due to White House policies such as reducing federal incentives, charging tariffs on vehicles, and abandoning emissions and mileage standards.However, the two companies said they are investing in the project at a time when demand for alternative fuels continues to grow across North America, and Pilot continues to diversify its offerings to meet the needs of guests and fleet customers, such as electrification, hydrogen, renewable diesel and higher-blend biodiesel.

Werner acquires dedicated fleet specialist FirstFleet
Transportation provider Werner Enterprises Inc. has acquired First Enterprises Inc., a Tennessee-based, privately-owned dedicated trucking company, for $245 million. Separately, Omaha, Nebraska-based Werner will also pay $37.8 million to acquire a portfolio of 11 real estate properties from First Enterprises, which does business as FirstFleet.According to Werner, the two moves establish it as the fifth-largest dedicated carrier in the U.S., meaningfully increase revenues from its higher-margin dedicated division, and deliver immediate accretion to earnings per share. FirstFleet will operate as a business unit within Werner’s TTS segment, complementing the existing Dedicated division.FirstFleet brings $615 million in annual revenues, approximately 2,400 tractors, 11,000 trailers, and 37 properties near 130 customer sites around the country. The firm says its capabilities are designed to service markets such as grocery, bakery goods, and corrugated packaging.In comparison, Werner in 2025 had approximately 7,365 total dedicated trucks and nearly 40,000 trailers. Today, Werner said that buying FirstFleet accelerates its recent efforts to grow its dedicated division, which offers high margins and long-term contracts. With the addition of FirstFleet, Werner expects to grow its dedicated revenues by 50% and become North America's fifth-largest dedicated carrier, as ranked by power units.“Powered by the talent of our combined associates, this partnership comes at the ideal moment for our company. By uniting FirstFleet's expertise in complementary new verticals with our resources and nearly 5,000 dDedicated trucks, we will improve our competitive position and accelerate profitable growth,” Werner’s Chairman and CEO, Derek Leathers, said in a release. “We are confident that, with the addition of the FirstFleet team, Werner will be stronger and even better positioned to serve our loyal customers and capitalize on profitable growth opportunities as market conditions continue to improve.”
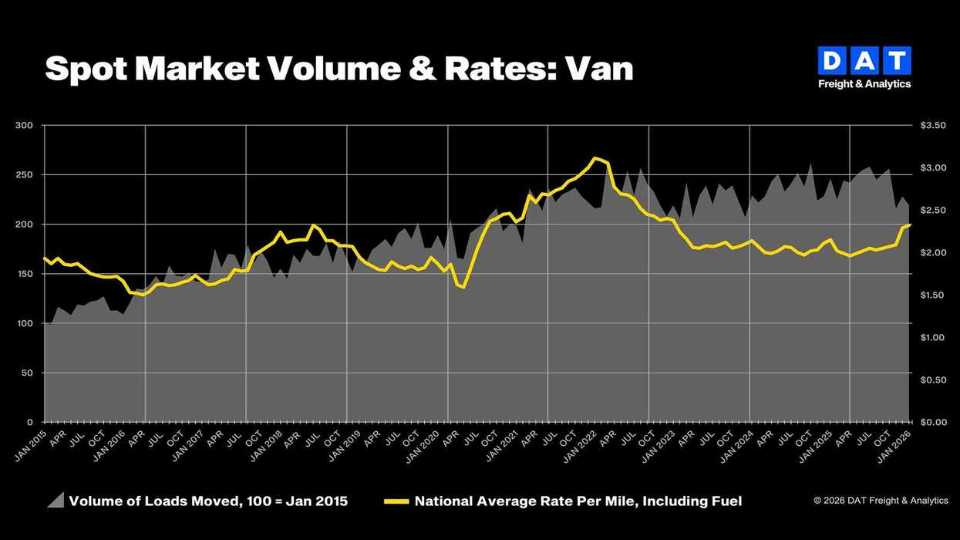
DAT: Spot market rates showed welcome increase in January
Truckload freight volumes declined in January following the holiday shipping season, while spot market rates continued to build on December gains, reported DAT Freight & Analytics.That change was measured by the firm’s DAT Truckload Volume Index (TVI), which measures demand for truckload services. The index declined month over month for van and refrigerated (“reefer”) loads, reflecting a post-holiday slowdown in retail and food shipments: Van TVI: 219, down 4% compared to December; Reefer TVI: 184, down 4%; Flatbed TVI: 257, up 2%.Despite those softer freight volumes, average spot rates increased in January, particularly for refrigerated and flatbed loads. DAT found that: Spot van rate: $2.32 per mile, up 3 cents from December; Spot reefer rate: $2.81 per mile, up 12 cents; Spot flatbed rate: $2.85 per mile, up 22 cents.Meanwhile, contract rates stayed stable in January: Contract van rate: $2.48 per mile, up 2 cents month over month; Contract reefer rate: $2.81 per mile, up 2 cents; Contract flatbed rate: $3.04 per mile, down 1 cent.“Not every spike or dip warrants a response,” Ken Adamo, DAT chief of analytics, said in a release. “What matters is whether the data signals a temporary disruption or a real shift in market fundamentals. January’s numbers didn’t mark a change in loads moved, but they did show how shipper urgency and carrier pricing discipline can push rates up despite softer volumes.”
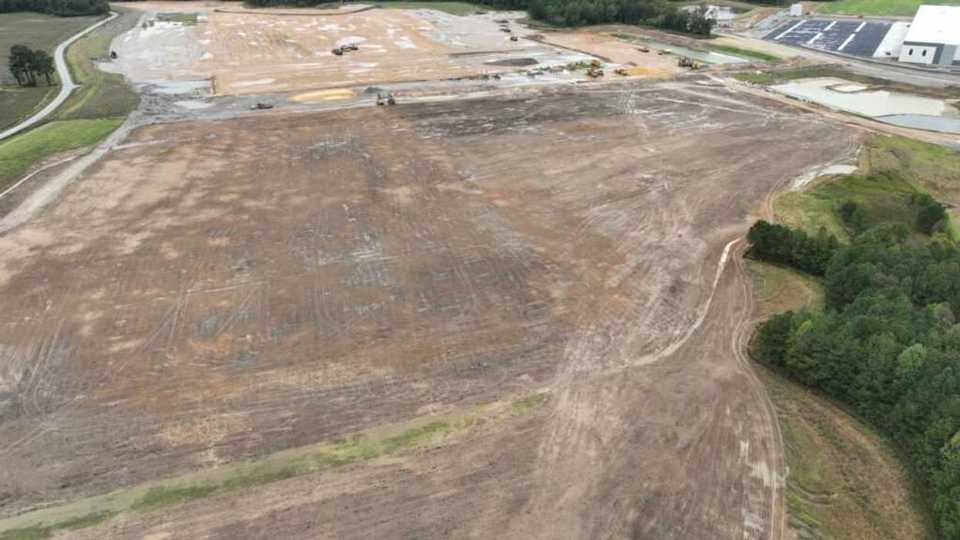
Walmart $330M Opelousas DC Automation Plan to Double Shipping Capacity
Walmart will pump $330 million into its 1.2 million-square-foot regional distribution hub in Opelousas, Louisiana, starting in 2026, aiming to double daily throughput with hundreds of autonomous vehicles while keeping 1,900 existing workers on the payroll. Walmart Opelousas Hub to Double Volume After $330M Upgrade The multiyear overhaul will add self-guided forklifts, high-density storage racks and IoT sensors throughout the facility that now ships grocery and general merchandise to more than 200 Walmart stores across the Gulf South. When the last conveyor belt starts—projected for 2028—the building is expected to ship twice the cartons per day without adding square footage, executives told local officials Monday. The sum equals more than one-third of Walmart’s entire 2024 U.S. capital budget for distribution automation, underscoring the company’s bet that speed, not footprint, will decide the next chapter of retail logistics. Automation Expands Across 42-Site Network Opelousas becomes the twenty-third regional distribution center slated for the retailer’s “next-gen” blueprint, a program that already feeds 60 % of domestic stores through mechanized buildings, according to internal December 2025 figures. Each upgrade follows the same Lego-like sequence: shut down one module at night, slide in robotic storage cells, re-train the shift before sunrise, then repeat. Walmart says the method has cut per-unit shipping cost by 14 % in comparable sites while shrinking average order-cycle time from 2.4 days to 1.3. The company’s 42-site target implies at least $3 billion in automation spending before 2030 if similar price tags hold. 1,900 Workers Move to Tech Roles Rather than trim headcount, Walmart will re-badge most floor employees as “tech troubleshooters” who monitor dashboard alerts, clear sensor jams and swap battery packs on self-driving pallet jacks. A 40,000-square-foot training lab—built on mezzanine space that once held static shelving—will host year-long certifications co-developed with South Louisiana Community College. Pay bands for graduates start $3.50 above the facility’s current $21.50 average, and the retailer has guaranteed no involuntary layoffs through 2029, a pledge written into the state’s $6 million workforce-grant agreement announced alongside the investment. Local Economy Expects Secondary Surge Construction alone will draw an estimated 600 electricians, millwrights and software integrators during peak phases, according to the St. Landry Parish economic-development district. Hotel bookings in Opelousas—population 16,000—have already doubled for 2026-2027 versus pre-announcement baselines, while concrete suppliers as far as Baton Rouge are expanding batch-plant shifts. “We’re seeing a mini-boom,” said Mayor Julius Alsandor, who expects sales-tax receipts to climb 8 % annually during the build-out. Walmart’s contractor roster, led by Massachusetts-based Symbotic, must source at least 30 % of subcontract dollars within a 250-mile radius under state incentive rules. Rivals Track Opelousas Timeline Competitors are watching the Opelousas project as a bellwether for mid-sized markets; Target is weighing a $200 million retrofit of its Augusta, Georgia, center, and Kroger recently broke ground on an automated cold-storage annex in Memphis. Industry analysts note that the U.S. grocery segment now spends more on automation per square foot than any retail category except e-commerce pure-plays, driven by razor-thin margins and same-day delivery promises. “The next differentiator isn’t who has robots, but who can keep them running 23.8 hours a day without burning out people,” said Cathy Roberson, president of Logistics Trends & Insights. Action Steps for Supply-Chain Stakeholders Map your current labor cost per case shipped; if above $0.42, budget for mechanized buffer lanes within three years to stay competitive with post-upgrade Walmart metrics. Negotiate workforce contracts now that include retraining clauses and wage escalators tied to tech adoption, mirroring the Opelousas retention model. Engage local colleges to create micro-credentials in PLC troubleshooting and AMR fleet management; talent pipelines shorten ramp-up time by 30 %. Schedule phased go-lives during lowest seasonal demand to avoid the revenue dips that plagued early 2023 automation rollouts at two regional retail hubs. Source: Walmart corporate announcement, St. Landry Parish officials, Logistics Trends & Insights

Chicago I-294/I-290 Interchange Tops 2026 List of Worst U.S. Truck Bottlenecks
Chicago’s Interstates 294 and 290/88 junction west of downtown has overtaken Fort Lee, New Jersey, as the nation’s slowest freight corridor, according to the American Transportation Research Institute’s 2026 bottleneck rankings released February 24.Chicago Interchange Now Ranked Worst Freight BottleneckThe Hillside interchange climbed from second to first in ATRI’s 15-year tally after 2025 data showed trucks averaging 25.4 mph at rush hour—barely faster than a city cyclist. The crawl wastes the equivalent of 436,000 drivers sitting idle for a full year, said Rebecca Brewster, the group’s president and COO. “Congestion is a payroll problem, not just a pavement problem,” she added.How ATRI Measures Truck DelayResearchers crunched 25 billion anonymous GPS pings from rigs traveling 325 freight-heavy highway segments. Algorithms score peak-period slowdowns, delay duration, and freight density; the 100 highest scores make the list. Nationwide, average rush-hour truck speed fell 2.8 percent to 33.2 mph in 2025, the fourth straight annual drop.Fort Lee Falls to Second After Nine-Year RunThe George Washington Bridge approach in Fort Lee—site of 2013’s “Bridgegate” scandal—had topped every list since 2012. Ramp signals and fresh pavement lifted average truck speed 0.7 mph last year, but deck work on the upper level could restore gridlock in 2027 if traffic rebounds quickly.South, Midwest Dominate 2026 Top TenAtlanta and Houston each place three corridors in the upper tier. In Atlanta, the I-285 junctions with I-85 (North), I-75 (North), and I-20 (West) rank third, fifth, and sixth. Houston’s I-69/US 59 interchanges with I-45 and I-10 sit fourth and eighth, reflecting petrochemical and port traffic back to pre-pandemic levels. Nashville, Cincinnati, and McDonough, Georgia, fill the remaining spots.Illinois Rolls Out $4 Billion Tri-State FixState crews began a $1.2 billion first phase of a $4 billion rebuild of the Central Tri-State Tollway, the main feeder into the problem interchange. Plans call for a fourth lane each way, new bridges, and real-time ramp metering. The Jane Byrne Interchange dropped out of the top 25 after an $800 million upgrade finished in 2023; officials hope the Tri-State project, due in 2029, repeats that result.Carrier and Shipper Work-AroundsOvernight detours via I-355 and I-80 bypass the Hillside tangle. Add 60-minute buffers for Chicago-area arrivals through 2029. Download ATRI’s free quarterly spreadsheet to price detours before bidding on regional lanes. Tender loads before 5 a.m. or after 8 p.m.; speeds inside the top 10 corridors jump 11 mph outside peak hours.Source: American Transportation Research Institute

Order Picking Labor Shortage: Warehouse Ergonomics & Automation Solutions
Order picking has become the toughest role to staff in U.S. distribution centers, with 20% of warehouse operators telling industry surveyors they cannot keep the positions filled and annual turnover topping 25%. Order picking now drives 55% of warehouse budgets Pick-and-pack labor swallows more than half of a typical facility’s operating budget, a share that keeps rising as same-day shipping windows shrink. A single picker can walk 8-12 miles per shift, lifting cases in zones that swing from 35 °F freezer aisles to 90 °F upper racks. The physical toll, zero-tolerance accuracy standards, and six-week training curve spin a revolving door that erodes service levels and inflates overtime budgets. ABC slotting and taller racks cut travel time Travel distance is the easiest cost to attack. Slotting the 20% of SKUs that generate 80% of picks within 75 ft of the pack bench trims foot traffic 18-22%. Going vertical helps too: 24-ft narrow-aisle racks double pick faces, and gravity-fed carton flow lanes keep fast movers at waist height. Facilities that map these changes before buying automation often recover 7-10% in daily throughput without adding staff. Voice and robots lift productivity 30% Hands-free, eyes-up voice systems have become the gateway tech: pickers wearing headsets confirm locations aloud, driving mis-picks below 0.2%. Collaborative robots take the next step, bringing shelves to stationary workers and eliminating half of all walk time. A modular automated storage and retrieval (AS/RS) mini-load can quadruple picks per labor hour in the footprint of four manual aisles, letting firms phase in capital spend as SKU counts grow. Automation curbs turnover and boosts pay A Material Handling Institute poll finds 98% of workers on assisted lines report higher productivity, and 60% feel less physical strain. Those numbers translate to tenure: tech-assisted operators stay three times longer than purely manual crews. Nearly half also earn premiums for running the equipment—an automatic raise that still costs less than endless recruiting. Career maps keep pickers promoted Clear advancement ladders beat blanket wage hikes when margins are thin. A typical path—picker → voice trainer → team lead → shift supervisor—can be finished in 24 months if each rung demands documented modules on WMS proficiency, lift certification, and Lean basics. Posting internal openings first and funding one outside course per year costs under $600 per employee yet halves first-year attrition. Action steps for warehouse executives Time 100 random picks next week; multiply travel minutes by fully loaded labor cost to build an ROI case for slotting changes. Pilot voice picking on the highest-volume SKU cluster—hardware leases start below $800 per headset. Add “automation mentor” to at least one hourly job description; promote from within once throughput rises 20%. Track accuracy, overtime, and voluntary turnover in the same dashboard; share monthly so labor and ops managers own one integrated metric. Useful resources WERC DC Measures Study – Annual benchmarking report on pick accuracy, cost per line, and turnover benchmarks. MHI Automation Roadmap – Free PDF outlining modular steps from voice to full AS/RS. OSHA Warehouse Ergonomics eTool – Checklists for slotting heights, lift limits, and anti-fatigue mats.
Truck Freight Market Q4 2025: Shipments Up 1.5%, Spending Rises 4.6%
U.S. truck freight ended 2025 with its first quarter-over-quarter shipment gain since mid-2022, yet freight volumes remain 15% below pre-recession levels, according to the U.S. Bank Freight Payment Index released this week.Q4 Truck Shipments Rise 1.5% Despite Prolonged SlumpThe seasonally adjusted data show 1.5% more loads moved nationally in October-December than in Q3, the first sequential uptick in ten quarters. While modest, the improvement broke a pattern of uninterrupted contraction that began when interest-rate hikes and inventory gluts slammed freight demand in mid-2022. Analysts caution that one quarter does not mark a recovery: volumes still trail year-ago levels by 4.9%, extending a 15-quarter stretch of annual declines that began in late 2021.Shipper Spending Surges 4.6% on Fewer Available TrucksCarriers that survived the three-year shakeout are now dictating pricing. Shippers paid 4.6% more per quarter to move the slightly larger freight pile, pushing total spending to its highest watermark since Q1 2024. The gap between cost and volume widened further on an annual basis—spending rose 5.2% versus Q4 2024 even though load counts dropped 4.9%. Diesel prices, down 5.2¢ a gallon last quarter, played no role in the inflation, underscoring that the driver is capacity, not fuel.Fleet Exits Shrink Capacity Across All U.S. RegionsBobby Holland, U.S. Bank’s director of freight business analytics, attributes the pricing power to “fleet exits and carriers reducing their rosters.” Long-haul fleets have parked or sold an estimated 63,000 tractors since early 2023, while large truckload companies trimmed driver counts by double-digit percentages. Regional data echo the squeeze: every U.S. region posted sequential spending gains, and four of five recorded year-over-year increases. The Southwest led with an 8.3% annual jump in outbound dollars, followed by the Southeast at 6.1%.Manufacturing and Construction Weakness Cap Freight ReboundMacro headwinds still restrain cargo generation. American Trucking Associations chief economist Bob Costello notes that manufacturing output, construction starts, and core consumer spending “all showed strain” late last year. The Institute for Supply Management’s factory index stayed below the 50% growth mark for the 21st consecutive month in December, while housing starts slid 3.1% in the same period. Without a clearer upturn in goods production, analysts say any volume bounce will remain muted.2025 Decline Slows to 9.9% After 2024’s 20.4% PlungeViewed annually, 2025 moved the market only halfway back to stability. Total shipments fell 9.9% compared with 2024—painful but far less than the prior year’s 20.4% collapse. The deceleration fuels cautious optimism that the freight recession is bottoming out, yet full recovery could lag broader GDP by six to nine months because carriers remain disciplined about re-fleeting. Until shipment growth turns positive on a year-over-year basis, Holland warns, “the industry is still operating in a deficit environment.”Action Steps for Shippers and Carriers Navigating Tight CapacityAudit lane mix now—consolidate lighter loads to improve truck-to-order density before spring produce season adds volume. Lock in contract rates through Q3; spot pricing typically jumps 8-10% between March and July when capacity is already lean. Re-examine carrier onboarding requirements—streamlined insurance and compliance checks can attract smaller fleets that re-enter the market at higher rate levels. Use drop-and-hook or pre-load programs to reduce driver wait time; excess dwell was the top reason carriers rejected 12% of tenders in Q4. Track weekly ratio of loads posted to trucks posted on DAT or Truckstop; a reading above 4:1 signals imminent rate spikes.

Fleets adjust focus from efficiency to resilience, Geotab says
The fleet sector is facing a perfect storm of inflation, high interest rates, and a cycle of mass fleet asset retirement referred to as “the pandemic echo,” according to a report from Geotab, a provider of video telematics and asset tracking solutions.Against those challenges, operational efficiency remains a priority, but resilience—the ability to absorb market shocks without losing momentum—has emerged as the primary survival strategy. That is the conclusion of Atlanta-based Geotab’s 2026 State of Commercial Transportation report, titled "Navigating the crossroads of resilience and reinvention."The pandemic echo describes a process in which fleets are currently managing a mass replacement of assets acquired during the pandemic. For example, the 2021 Ford Transit, the top-acquired vehicle of its era, became the most retired model in 2025, confirming a strict four-year replacement cycle for high-utilization vans.Data suggests many fleets are sitting on idle capital; on average, vehicles are active only 186 days per year, prioritizing availability over optimized total cost of ownership (TCO). While repair speeds have improved by up to 25% year-over-year, breakdown frequency has risen, necessitating proactive health monitoring.Another challenge is that safety risk remains highly concentrated in a few drivers. Modeling reveals that the riskiest 10% of drivers account for 1 in 5 collisions and are 7.4 times more likely to crash than the safest drivers. And speeding remains a critical precursor to accidents; severe speeding (20% above the limit) was found to trigger a 7-fold surge in collision probability within just five seconds.However, overall safety has improved; Geotab’s longitudinal analysis shows significant long-term progress in road safety across the continent. Over a five-year period (2021–2025), the U.S. and Canada saw a 38.7% reduction in collisions per million miles."The industry is navigating a perfect storm of economic pressure, but the data shows that fleets are responding with incredible adaptability," Mike Branch, VP of Data & Analytics at Geotab, said in a release. "Whether it is rightsizing assets to combat the repercussions of the pandemic, or using generative AI to identify maintenance failures before they happen, our customers are proving that data is the ultimate defensive layer against volatility."

FedEx firms up plan to spin off LTL division on June 1
FedEx has taken two steps closer to its goal of spinning off its FedEx Freight division, saying when the new company launches on June 1, it will instantly become the country’s largest less-than-truckload (LTL) carrier.First announced 12 months ago, the plan has met with approval from financial analysts and from stock market investors.To reach that goal, FedEx said Friday it had filed a Form 10 registration statement with the U.S. Securities and Exchange Commission (SEC) for the planned spin-off of FedEx Freight.“Today’s Form 10 filing reflects the strong progress we are making toward the launch of FedEx Freight as a focused, industry-leading LTL company,” said Raj Subramaniam, FedEx Corp. president and CEO. “This separation will create two world-class companies, positioning both FedEx and FedEx Freight to better serve customers and unlock long-term value for all stockholders.”Also Friday, FedEx announced the names of the 10-member board of directors for FedEx Freight, saying they include “veteran leaders with transportation and logistics, financial, and technology expertise.” Those directors will work with R. Brad Martin, the planned chairman of the board of FedEx Freight and current executive chairman of the FedEx Corp. board of directors.
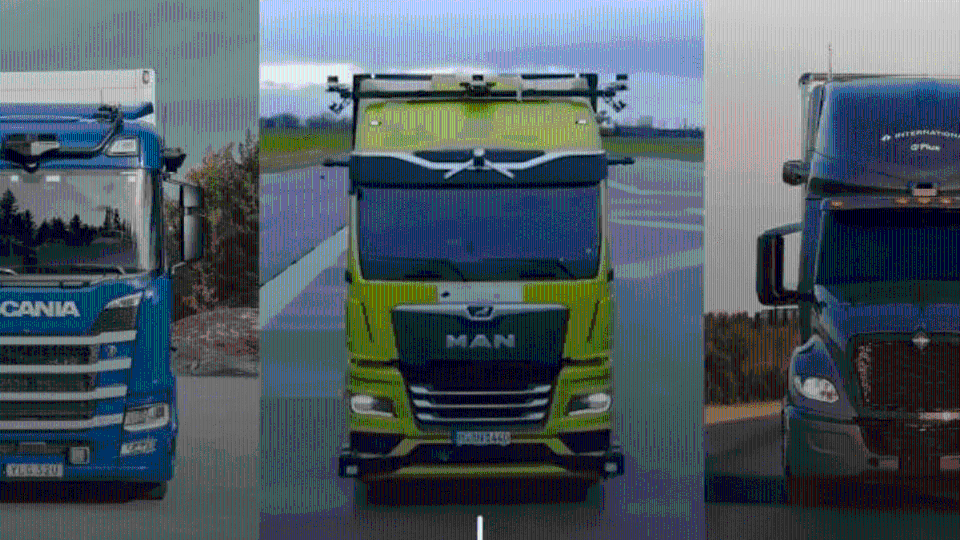
PlusAI and Traton Expand $25M Partnership for Autonomous Trucking
Traton to Invest $25 Million in PlusAI for Level-4 Truck AutonomyTraton Group will pump up to $25 million into Silicon-Valley software house PlusAI so that Scania, MAN, and International lorries can leave the factory with Level-4 highway autonomy already built in, the companies said Tuesday, extending a two-year collaboration.Traton Ups R&D Spend to $25 MillionThe capital—released in quarterly tranches tied to hardware validation, code delivery, and safety sign-offs—shifts the project from prototype testing to commercial-scale planning. The sum equals the yearly connectivity budget of some global OEMs, a marker of how vital self-driving tech has become to Traton’s earnings forecast.SuperDrive Built In on Assembly LineSuperDrive will be embedded during body-on-frame marriage, not bolted on later. That gives PlusAI direct access to engine, brake, and steering controllers aftermarket kits never touch, cutting latency to under 40 milliseconds—about half the SAE-cited benchmark. Traton brands gain one software image flashable over-the-air, ending the patchwork of separate ECU updates that slow new-truck launches.U.S. and Europe Pilots Rack Up MilesSince the 2024 CES reveal, International trucks have covered 180,000 autonomous miles on Texas interstates for a Fortune 100 retailer, running in 100 °F heat and winter storms that dropped visibility to 300 ft. In Sweden, Scania rigs haul 40-ton timber trailers on the E4 between Söderhamn and Gävle, climbing 8 percent grades and threading roundabouts. Safety drivers remain, yet disengagements have fallen 38 percent quarter-over-quarter, PlusAI notes.Driver Gap Fuels Automation PushThe U.S. now lacks about 64,000 long-haul drivers, ATA figures show; Europe’s IRU pegs its shortage at 300,000. First-year turnover tops 100 percent in both regions, pushing per-mile labor cost past $0.65 before benefits. Traton claims Level-4 interstate runs could lift tractor utilization from 7.2 hours a day to near 20, doubling revenue per truck and offsetting an estimated $25,000–$30,000 hardware premium.2028 Market Launch on the TableNiklas Klingenberg, Traton R&D board member, told analysts a late-2026 go/no-go decision will determine whether SuperDrive appears on 2028 models. Validation hurdles include redundant steering actuators and cyber-pen tests by TÜV and U.S. DOT. MAN engineers in Munich already reroute firewalls for extra lidar harnesses; Scania’s Södertälje plant runs a digital twin workstation that stress-tests virtual trucks against logged highway data before metal is cut.Action StepsFleets running 50-plus tractors should contact Scania, MAN, or International dealers now to secure early-build slots when order books open in 2027. Risk managers must update policies to cover software malfunction; autonomous-specific riders are available from Axa and Travelers. Dispatch teams can map limited-access, divided highways with HD lanes to calculate potential daily mileage gains under Level-4 exemption rules.Source: Company statements, industry filings

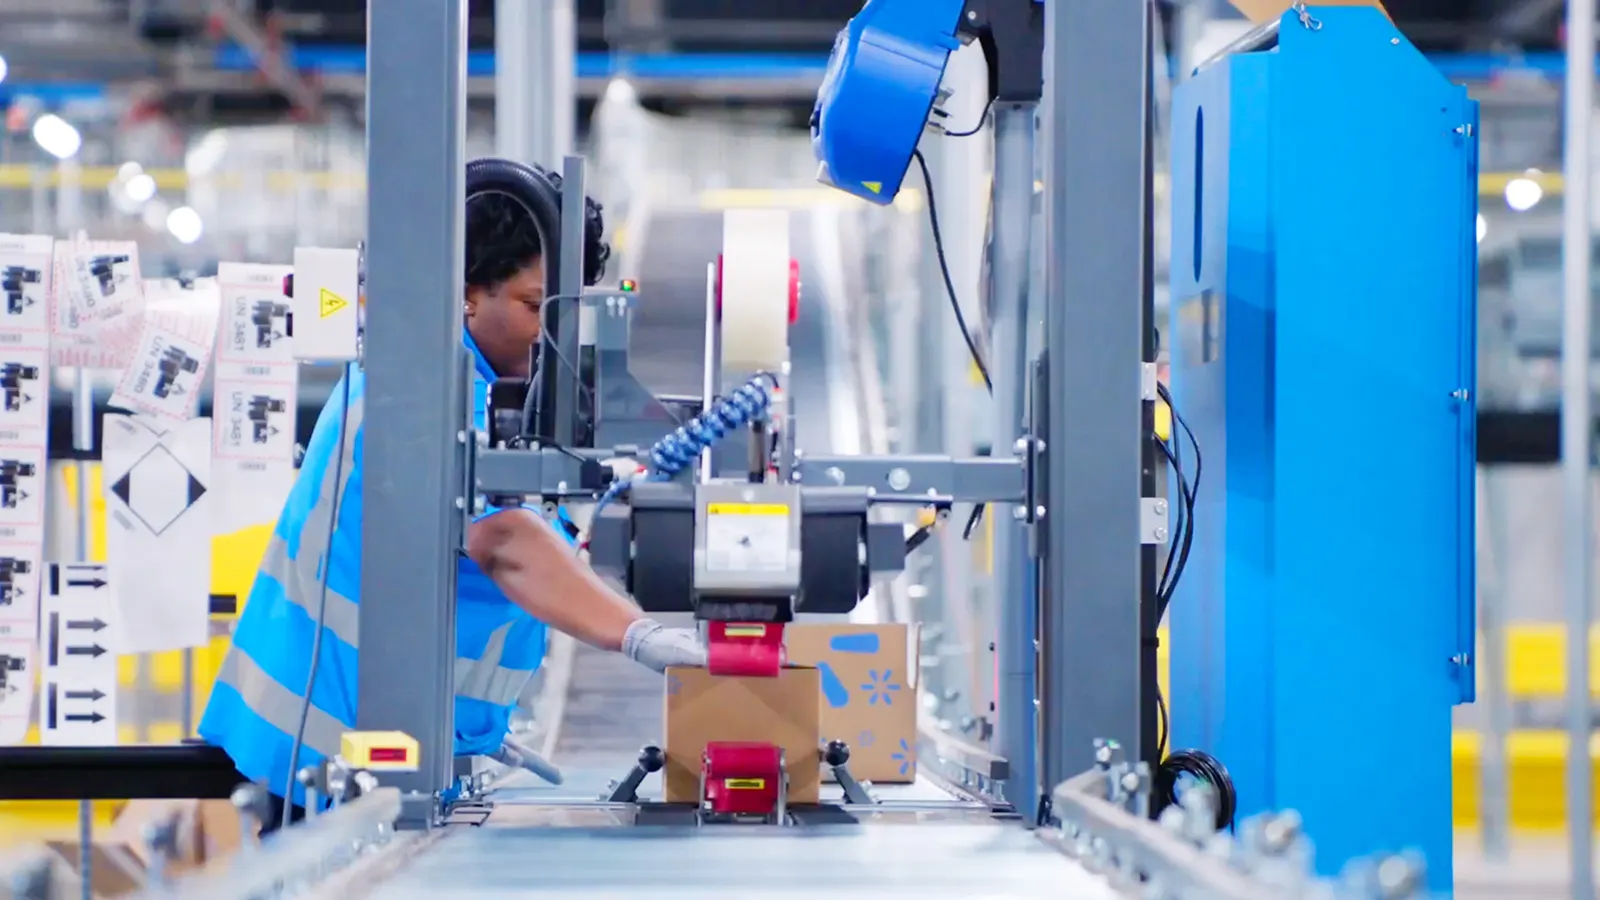
How a cookware company is using Amazon’s supply chain services
Small and mid-sized manufacturers increasingly leverage comprehensive distribution platforms to streamline inventory management and logistics operations. Recent implementations demonstrate significant time reallocation potential—executives report reduction of daily operational oversight from 30+ hours weekly to under six hours through automated replenishment and coordinated logistics systems.This operational compression enables strategic resource reallocation toward product development and market expansion rather than tactical supply chain management.Distribution Infrastructure: From Fragmented to IntegratedTraditional distribution architectures require coordination across multiple intermediaries: freight forwarders, third-party warehouses, and final-mile delivery networks. This fragmentation introduces procedural delays and information asymmetries.Legacy Distribution Process Complexity:StageTypical DurationOperational FrictionForwarder coordination and documentation2-3 daysManual data entry, approval cyclesOcean freight transit14-30 daysVisibility gaps, exception management3PL receiving and processing2-7 daysReceiving list generation, work order creationFinal-mile preparation (small parcel)2-3 daysLabel generation, carrier coordinationFinal-mile preparation (LTL)5-6 daysPallet dimension verification, label transmissionFBA delivery completion7-10 daysInbound processing, inventory availabilityTotal cycle time from port arrival to customer-fulfillable inventory: 14-26 days under conventional distribution models.Integrated Distribution Solutions:Automated warehousing and distribution systems consolidate these fragmented stages. Key operational capabilities include:Auto-replenishment algorithms: Inventory levels trigger automatic forward distribution to fulfillment nodes without manual interventionPreloaded product specifications: Master data management eliminates repetitive documentation for recurring shipmentsDirect manufacturer coordination: Platform-managed loading operations bypass intermediary communication chainsInstant freight quotation: Algorithmic rate generation enables immediate shipment authorizationGlobal Distribution Network ComplexityMulti-country manufacturing operations face compounded documentation requirements, duty calculation variations, and customs clearance protocols. Traditional approaches require specialized expertise for each jurisdiction, creating operational bottlenecks and compliance risks.Integrated global logistics platforms standardize these processes through:Centralized documentation templates adaptable to jurisdiction-specific requirementsAutomated duty calculation engines with real-time tariff database integrationUnified customs clearance workflows reducing port-of-entry variabilityEmerging Capability: Global Warehousing and DistributionPlanned platform extensions will enable inventory positioning at manufacturing origins rather than destination markets. This architectural shift supports:Capital efficiency: Reduced safety stock requirements through proximity sourcingMarket responsiveness: Rapid inventory redeployment across regional fulfillment networksProduct portfolio expansion: Freed working capital enables SKU proliferation and marketplace diversificationStrategic Implications for Distribution ManagementOperational Transformation MetricsMetricTraditional ModelIntegrated PlatformImprovementWeekly management hours30+<680% reductionReceiving-to-availability cycle14-26 days3-7 days70% compressionManual documentation touchpoints8-122-375% reductionInventory carrying costBaseline-15-25%Capital efficiencyActionable Recommendations by Stakeholder CategoryFor Operations Executives:Conduct distribution network audits identifying fragmentation points with >2-day processing intervalsEvaluate integrated platform adoption against current 3PL coordination costs, including hidden management overheadimplement pilot programs in single-origin product categories to validate cycle time compression before network-wide deploymentFor Supply Chain Strategists:Assess manufacturing footprint optimization opportunities enabled by global warehousing capabilitiesModel inventory positioning scenarios comparing destination-market storage versus origin-proximity strategiesDevelop capital reallocation frameworks capturing working capital released through reduced safety stock requirementsFor Financial Planning:Quantify management time reallocation value using loaded cost rates (typically $75-150/hour for executive oversight)Calculate inventory carrying cost reduction using weighted average cost of capital (typically 8-15% annually)Evaluate platform fee structures against current 3PL markup aggregation (typically 15-25% above direct costs)For Technology Integration:Audit existing ERP/WMS API compatibility with integrated distribution platformsAssess master data quality—product specifications, carton dimensions, HS codes—for preloading readinessDevelop exception management protocols for platform-automated processes requiring human interventionFor Small and Mid-Sized Manufacturers:Prioritize SKU standardization to maximize auto-replenishment algorithm effectivenessNegotiate manufacturer direct-shipping agreements enabling platform-coordinated loadingMaintain dual-source distribution capabilities to prevent platform dependency risksCritical Insight: The 2026 Distribution Platform ConsolidationAmazon Accelerate 2025 announcements indicate accelerated vertical integration in third-party distribution services. The convergence of warehousing, global logistics, and fulfillment capabilities into unified platforms represents structural transformation in distribution economics.Market Data Context:The global 3PL market reached $1.8 trillion in 2026, with integrated platform services capturing disproportionate growth in the mid-market segment . Traditional freight forwarders and standalone 3PLs face margin compression as platforms aggregate demand and disintermediate conventional intermediaries.Regulatory Consideration:Emerging antitrust scrutiny in North American and European markets may impact platform exclusivity arrangements. Distribution strategists should maintain multi-channel capabilities despite short-term operational efficiencies from single-platform concentration.Action Tips: Organizations currently utilizing fragmented 3PL networks should initiate integrated platform evaluation within Q2 2026. Early adopters in 2024-2025 report 12-18 month operational learning curves; competitive positioning advantages will diminish as platform adoption reaches saturation in 2027-2028.