
Supply Chain Automation: Strategic Growth Driver Beyond Cost Savings
Automation now tops every short-term fix list for warehouse labor shortages, demand spikes, and faster delivery promises, executives from retail, manufacturing, and third-party logistics told industry panels this year. From Cost-Cutter to Revenue Driver Fifteen years ago a conveyor belt was booked as a payroll trimmer; today the same line sits under “revenue enablement.” Modern goods-to-person systems slice pick times 55 % while feeding SKU-level data to pricing engines. That pairing—speed plus intelligence—turns a one-off purchase into a platform that can be ramped up for holiday peaks and dialed back in January without hiring or firing, a flexibility boards now value above short-term wage savings. Labor Scarcity Rewrites Fulfillment Job Descriptions Warehouse employment in the United States is still 6 % below its 2019 level even though e-commerce volume has doubled, Bureau of Labor Statistics data show. Younger applicants rank “technology” and “career path” ahead of hourly pay. When tote transport or palletizing is handed to robots, companies recast staff as robot coordinators, data analysts, or exception handlers—jobs that pay more and stay filled. The shift gives recruiters an edge in markets where seasonal vacancy rates can hit 40 %. Adaptive Capacity Outruns Market Volatility The pandemic, the Suez blockage, and Red Sea diversions proved that static footprints buckle when volume swings 30 % in a quarter. Modular sorters, autonomous mobile robots, and micro-fulfillment nodes can be leased or redeployed within weeks, letting firms absorb surges without signing long warehouse leases. During the 2025 holiday cycle, retailers with plug-and-play automation hit 97 % of next-day promises versus 82 % for peers that relied on manual overflow, parcel-tracking group MetaPack reported. Hidden Costs of Waiting Outweigh Installation Risks Each month of delay erodes margin in ways a capex sheet never shows. Overtime premiums, inventory shrink from rushed handling, and re-ship costs after mis-picks can total 6 % of net sales, Deloitte calculates. Add the social-media fallout of one bad unboxing and the cash-equivalent damage quickly surpasses the annual lease rate of an entry-level AMR fleet. Three-Wave Roadmap Turns Supply Chain Into Innovation Hub Firms that automate in sequence—first data visibility, then mechanized movement, finally AI-driven optimization—deliver a 15 % higher internal rate of return than those that tackle random pain points, MIT’s Center for Transportation & Logistics reported in 2025. Cross-functional teams co-led by operations and IT release working capital trapped in inventory, funding each new wave and keeping the network one step ahead of competitor moves. Action Steps Map order profiles and SKU velocity to find bottlenecks where automation unlocks data as well as speed. Model labor, inventory, and service-level scenarios over five years; include the cost of stock-outs and brand erosion, not just wages. Pilot a scalable technology—e.g., autonomous carts—that can be re-leased if volumes shift, limiting stranded-asset risk. Build upskilling paths tied to new equipment so employees view robotics as a promotion vehicle, not a pink slip. Review performance quarterly; redeploy savings into the next automation wave before market volatility widens. Sources: Bureau of Labor Statistics; MetaPack; Deloitte; MIT Center for Transportation & Logistics
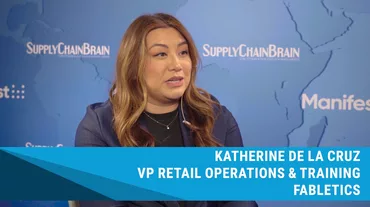
Fabletics RFID Inventory System Boosts Store Accuracy and Sales
Fabletics stitches RFID tag into every sports bra and legging, pushing inventory accuracy to 99% and cutting store labor hours across 114 U.S. locations, executives said two days before the brand receives the inaugural Masters of Innovation Award at Manifest 2026.RFID Fleet-Wide in Six MonthsKatherine Dela Cruz, vice-president of retail operations and training, told SupplyChainBrain that once tag standards were locked, the chain-wide install took “roughly half a year,” a pace she credits to early buy-in from both the C-suite and Asian factory partners. Each garment now carries a serialized license-plate ID—style, color, size, plus a unique number—feeding warehouses, e-commerce, and stores without relabeling. Twenty outlets slated to open in 2026 will launch RFID-ready.2018 Pitch Becomes Factory-Floor RealityTalks began in 2018 when Dela Cruz’s team translated shrink reduction and floor efficiency into ROI terms for executives who already treat Fabletics as “a tech firm that happens to sell leggings.” The harder part, she said, was deciding which data fields to encode so tags stayed useful through distribution, replenishment, and returns. Final specs require vendors to embed tags at manufacture, erasing downstream rework and ensuring 100-percent source tagging before cartons sail.Smart Mirrors Track Conversion, No Hand Scans NeededOverhead readers and fitting-room sensors grab the tag’s EPC number the moment a shopper enters with an armful. The mirror auto-pulls alternate sizes, killing barcode scans and logging which pieces convert. Dela Cruz credits the fitting-room data with “single-digit-percent lifts” in units per transaction; stylists now get real-time nudges to show matching accessories already on the floor.Morning Cycle Count Drops From 2 Hours to 20 MinutesInventory counts that once tied up two employee hours per store now finish in 20 minutes via a handheld sled that reads thousands of tags a minute. The freed time flips to “customer storytelling,” Dela Cruz said—explaining recycled fabrics or pitching the Fabletics VIP subscription. District managers report hourly payroll down 6–8 percent while net promoter scores climb, an outcome the company labels direct payback on its seven-figure RFID spend.Award Caps Three-Year SprintThe Masters of Innovation honor, presented jointly by SupplyChainBrain and Let’s Talk Supply Chain at Manifest 2026, singled out Fabletics for “scaling item-level RFID across a vertically integrated fashion brand without disrupting seasonal drop cadence.” Judges cited hard ROI—shrink below 1 percent for the first time—and softer gains in experiential retail, a balance many apparel chains still chase.Action Steps for RetailersAudit current inventory accuracy; if cycle-to-book variance tops 3 percent, pilot RFID on one high-velocity category. Negotiate source-tagging contracts with top three suppliers to avoid relabeling costs. Map in-store chokepoints—fitting rooms, back-of-house replenishment—where automatic reads can free labor for client-facing tasks. Layer sensor data onto POS reports to quantify conversion lift before scaling fleet-wide.Sources: SupplyChainBrain, Let’s Talk Supply Chain

FSMA Section 204 Food Traceability Requirements for Grocery Retailers
Grocery chains and their suppliers have 24 months to build a digital paper trail that can pinpoint every pallet of sprouts, wheel of brie, and crate of tomatoes within a day of an FDA request, a requirement that will cost mid-size retailers upwards of seven figures and force thousands of small vendors to log data for the first time.FDA Traceability Rule Sets 24-Hour Data DeadlineThe January 20, 2026 deadline anchors the Food and Drug Administration’s most aggressive attempt to shrink the average six-week outbreak investigation window. Foods on the agency’s Traceability List—currently 16 categories that account for 85 % of FDA-tracked illnesses—must carry a unique lot code from harvest or production through final sale. Regulators can demand Key Data Elements (KDEs) such as origin coordinates, harvest crew identifier, internal temperature at receipt, and the precise minute a shipment left the distribution center. Records must be retrievable electronically within 24 hours and stored for 24 months; paper binders in a back office no longer satisfy the statute. Failure to produce complete KDEs exposes retailers to Warning Letters, product detention, and—in repeat cases—criminal referral.High-Risk Foods Face Strictest Tracking RulesSoft-ripened cheeses, sprouts, tomatoes, crustaceans, and mollusks top the list because microbial loads can double every 30 minutes when temperature drifts. Each container must now display a scannable traceability lot code that survives processing; if a grocer slices, repacks, or cooks the item, a new code is generated and linked to the original. Central kitchens supplying 200-store deli networks must therefore create thousands of additional identifiers daily, a task most legacy ERP systems were never designed to handle. FDA allows limited exceptions—random-weight cheese cut to order in-store, for example—but any commingling of lots erases the exemption and triggers full recordkeeping.Three-Phase Rollout Stresses Supplier IntegrationRetail technologists describe the rollout in three waves: supplier onboarding, distribution-center retrofit, and store-level activation. Phase-one negotiations are already turning contentious; regional produce shippers using 1990s accounting software cannot export CSV files, forcing buyers to choose between dropping vendors or accepting handwritten invoices scanned into shared drives. Mid-size chains report that 30 % of their produce suppliers fall into this low-tech bucket, pushing pilot costs far above early estimates. Warehouses come next: WMS upgrades average $250 k per site when handheld scanners, new label stock, and API middleware are tallied. Stores then receive “last-mile” dashboards that alert department managers when a recalled lot is still on shelves—provided the upstream data are accurate.Supplier Tech Gaps Drive Up CostsIn Immokalee, Florida, one eight-truck tomato packer still prints daily manifests on carbon paper; its retail customers now key the data in by hand. Critics argue that such gaps could add $6–$8 per pallet in labor, wiping out thin produce margins. A typical 400-store chain receiving 2,000 inbound loads weekly could absorb $16 million in annual surcharges if electronic integration stalls. IT departments are building “data lakes” that accept Excel templates via e-mail until APIs come online, a patch that satisfies FDA but complicates analytics. Interoperability remains elusive; four competing GS1 standards for lot-code syntax mean one supplier’s barcode may crash another’s parser, forcing redundant relabeling inside distribution centers.Traceability Becomes Retail Competitive EdgeKroger, Walmart, and Amazon Fresh already track every FSMA-listed item plus another 500 SKUs of their own choosing, betting that consumer-facing QR codes will boost loyalty. Internal studies show shoppers willing to switch banners for real-time farm data, giving early adopters a 1–2 % lift in produce dollar share. Venture funding mirrors the trend: traceability start-ups raised $1.3 billion in 2023, triple the 2020 level, as retailers seek cloud platforms that merge compliance with marketing analytics. The competitive arms race now compresses timelines; several national chains will require full KDE submission from suppliers by July 2025, six months ahead of the federal mandate.Actionable Roadmap for Grocery ExecutivesProcurement teams should finish supplier-tech audits by Q4 2024 and insert KDE delivery clauses into 2025 vendor contracts, allocating penalty fees for late or incomplete files. Logistics managers must re-slot warehouses so that full-truck-load items never share pick lanes with general merchandise, cutting cross-contamination risk and audit time. CIOs need to fund middleware that translates KDEs into existing ERP tables rather than rip-and-replace projects that can exceed $50 million. Finally, risk departments should run mock recalls quarterly; FDA’s pilot program shows retailers that test their data pipelines find 15 % more breakage than those relying on desktop reviews.Action StepsMap every FSMA-listed SKU to its current lot-code generator; flag gaps by August 2026. Contract a traceability platform that offers both API and manual-upload lanes for small suppliers. Re-train receiving clerks to reject pallets lacking scannable traceability codes starting January 2026. Schedule a cross-functional mock recall before the 2026 holiday freeze; target retrieval in under 12 hours. Budget for a second WMS terminal per cold-storage door—shared devices become bottlenecks during audits.Sources: Food and Drug Administration, GS1 US, National Retail Federation

Watch: Private Equity Investment in Supply Chain Companies
As supply chain companies become ever more integral to the economy, private equity investors are putting more and more funding into them, says Jay Koh, managing director and co-founder of The Lightsmith Group.Private investors are interested in putting money into highly productive parts of the economy, and it goes without saying that the supply chain is critical to all products, services and trade flows, Koh says.“Whether you're a multinational company or a consumer, having the supply chain operate in efficient, reliable manner despite whatever complexity is out there is really important,” he says. “So the value created by the companies that do that is exactly what private equity is interested in.”Investment in such companies is hardly new, but there’s a more serious interest in pinpointing the winners in supply chain and logistics companies today as the industry grows more complex. “If private equity can work long-term with the best management teams that can really generate that value, that's what's attractive, especially at this moment of increasing complexity,” Koh says.Growth equity investors must be prepared to work with a company and its board and help it expand internationally if it’s to realize the next phase of its growth, he says. That often means holding companies longer these days, but the hope is that major value is found in the long term.Climate change, tariffs and labor disruptions are among the factors increasing complexity in supply chain and logistics companies in recent years. “The first thing to do is to really understand how that risk and complexity is affecting the movement of goods and services in the supply chain,” says Koh. “More importantly, begin to understand that if you can manage your supply chain in a reliable, resilient way and your competitor can't, you will have a long-term competitive advantage.”

Amazon Pharmacy Same-Day Expansion: 4,500 Cities, Kiosks, Rural Ferries
Amazon Pharmacy to Reach 4,500 Towns by End-2026, Adding Ferries, E-Bikes, and Horse-Drawn Wagons Amazon Pharmacy will expand same-day prescription delivery to about 4,500 U.S. towns by the close of 2026, adding almost 2,000 new ZIP codes and entering its first sites in Idaho and Massachusetts. The build-out relies on cargo ferries, e-bikes, horse-drawn rigs, and a fleet of electric vans to reach pharmacy deserts where the nearest drugstore can sit an hour away. Urban E-Bikes to Rural Ferries: Mapping the Last-Mile Mix Dense cores such as Manhattan receive insulated pouches via courier e-bikes that weave through traffic in under two hours. Suburban hubs like Chesterbrook, Pennsylvania, swap pedals for electric vans that fan out to cul-de-sacs once or twice a day. Remote outposts—Mackinac Island, Michigan, for instance—see prescription bags arrive on the morning ferry, then complete the final mile by horse-drawn carriage. Amazon’s routing engine assigns each address to the lowest-cost modal option that still meets the promised delivery window, a calculus that now extends to Navajo Nation territory and bush-plane villages in Alaska. Kiosks at One Medical Cut Prescription Abandonment Inside a handful of Los Angeles One Medical clinics, waist-high kiosks stocked with the 150 most-prescribed primary-care drugs spit out labeled vials within three minutes of checkout. Early data show the on-site units convert more than 90 percent of newly written scripts, a sharp jump from the national average that sees one in three prescriptions never filled. Inventory algorithms refresh each machine nightly based on local prescribing patterns, turning the clinic lobby into what supply-chain engineers call a “micro-fulfillment node” that sidesteps the costliest leg of parcel shipping. Competitors Shutter Stores as Amazon Adds Routes CVS has closed 900 locations since 2022 and lists another 235 for closure this year; Walgreens is trimming at least 500 doors in 2025 on its way to a three-year cull exceeding 1,000. Rite Aid’s bankruptcy auction ended with complete liquidation last October. The retreat leaves 30 million Americans living in areas the CDC classifies as pharmacy deserts, a gap Amazon’s logistics playbook is designed to capture while Walmart races to match the service with its own same-day cold-chain program for insulin and antibiotics. Refrigerated Fleet and Controlled-Substance Limits Same-day promise stops at the fridge door—for now. Temperature-sensitive biologics and controlled drugs ride in separate, insulated totes that require signature confirmation and cannot be dropped at a kiosk, keeping Amazon inside most state board-of-pharmacy rules. Company spokeswoman Sara MacLean said expansion into Schedule III pain creams or GLP-1 injectables “will follow regulatory guidance,” hinting that additional cold-chain vans and age-verification steps are on the 2026 roadmap. Regulatory Timeline Collides with PBM Reform California’s new pharmacy-benefit-manager law—banning spread pricing and forcing pass-through reimbursement—kicks in January 2026, the same year Amazon’s nationwide build-out completes. Analysts at SSR Health predict the transparency statute could shave 120–150 basis points off per-script margins for mail-order channels, prompting Amazon to accelerate its kiosk strategy where real-estate and labor costs are fixed and controllable. Employers that redesign formularies now can steer patients toward delivery or kiosk options before reimbursement tightens. Action Steps Verify your ZIP code on Amazon Pharmacy’s coverage map; Idaho and Massachusetts residents gain eligibility this quarter. Ask your One Medical provider if the lobby kiosk stocks your maintenance drug to eliminate a second trip. Request pill-pack synchronization if you take three or more daily meds—pre-sorted pouches ship free and raise adherence scores used by insurers. Employer benefits teams should amend PBM contracts to reimburse kiosk and home delivery at parity with retail, locking in adherence rebates before 2026 rate resets.
8 Supply Chain Technology Trends Driving Faster Disruption Response
Only one in six supply chains can react to a disruption within a day, yet buyers are now demanding software that can shrink that window to hours and push recovery time below the industry-average five-day mark. Performance Gap Drives 24-Hour Recovery Mandate A fresh industry benchmark shows that 83 percent of global networks still need longer than a full business day to detect, diagnose, and begin correcting an exception. Regional freight data sharpen the pain: when a one-week ocean or trucking shock hits, more than half of manufacturers and retailers need up to six months to restore prior flow. Procurement teams have responded by inserting hard recovery-time clauses into RFPs, often capping allowable downtime at 36 hours for mission-critical lanes. The upshot is that vendors pitching “comprehensive functionality” lose ground to those that can publish auditable response-speed metrics—even if their feature list is shorter. Intraday Labor Rebalancing Replaces End-of-Shift Fixes Continuous productivity tracking inside the four walls has matured from pilot to default setting. Modern warehouse modules stream zone-level throughput every three to five minutes; when pick rates drift more than eight percent below target, the system auto-suggests moving employees, opening an overflow dock, or switching batch logic. Managers at mixed-profile sites—where e-commerce singles and wholesale pallets share the same pick path—say the tool prevents a two-hour backlog from snowballing into an overtime shift. Early adopters report 6-11 percent labor-cost savings without touching service-level agreements, a figure that jumps to 14 percent when paired with dynamic slotting. Agentic AI Moves From Demo to Day-to-Day Decision Owner Software agents that can sense, decide, and act—without a human checkpoint—are exiting the innovation lab. Analysts forecast that one in three enterprise applications will host such agents by 2028, up from fewer than one in a hundred today, and at least 15 percent of routine supply-chain choices will be made autonomously. Logistics leaders are testing three deployment lanes: lightweight bolt-ons for tasks like carrier appointment scheduling; native agents embedded inside upgraded WMS or TMS cores; and low-code micro-agents purpose-built for proprietary processes such as cold-chain temperature exception handling. The common denominator is a rules engine able to authorise inventory moves, carrier switches, or labor reassignments inside guardrails set by operations leadership. Hidden Data Bill Adds 50 Percent to AI Agent Price Tag Behind the glossy ROI slides lies an unbudgeted line item: master-data remediation. Agents need a single, real-time version of stock, shipment, and order records; siloed ERP, TMS, and WMS tables must be rationalised and piped through secure APIs. Solution architects familiar with early rollouts say total project cost routinely climbs 40–60 percent once taxonomy clean-up, API throttling, and governance layers are added. Cloud-native companies that already run unified data lakes are clearing this hurdle in a single sprint; legacy operators can spend two budget cycles just aligning SKU definitions before the first agent goes live, tilting competitive advantage toward firms with cleaner digital foundations. Tier-Two Visibility Gap Leaves 80 Percent of Networks Blinded Most organisations can name every direct supplier, yet visibility plunges to 21 percent at the second tier and barely 2 percent at the third, leaving planners blind to upstream capacity or compliance shocks. SCM providers are racing to stitch together external data feeds—capacity calendars, ESG certificates, IoT sensor streams—into a shared visibility layer, but integration remains uneven. Until those pipes solidify, risk teams recommend starting with critical-path commodities: identify the five components whose loss would halt production, map their sub-suppliers manually, and contract alternative sources one tier deeper than usual. Actionable Next Steps for Supply Chain Leaders Insert a maximum 24-hour recovery clause in next-year carrier and software contracts, and require a documented playbook for three common disruption scenarios. Run a two-week proof of concept that rebalances labor every 30 minutes inside one high-velocity DC; track pick productivity, overtime hours, and cutoff compliance to build an internal ROI case. Commission a data-readiness audit before purchasing any agentic-AI license; budget an extra 50 percent for API and taxonomy work if your systems are on-premise or fragmented. Map tier-two suppliers for your top three revenue-critical components; secure at least one alternate source and enter its capacity calendar into your visibility platform to reduce blind-side risk.
Supply Chain Automation: Cut Hidden Costs and Build Resilient Growth
Automation has moved from a cost-cutting tactic to a growth lever that lets supply chains add volume without adding people, executives told industry webinars through late 2025. Labor Shortages Push Warehouses Toward Robotics Hiring for warehouse jobs keeps getting harder.Turnover in transportation and storage averaged 46 % last year, U.S. Bureau of Labor Statistics data show—double the private-sector mean.Instead of refilling the same physically intense roles, companies now install robotic palletizers, automated storage towers, and sensor-guided sorters.The swap turns repetitive lifting into monitored, semi-skilled technician work that younger recruits treat as a career, not a stopgap. Automation Extends Beyond the Four Walls Modern control towers pull sensor data from docks, trucks, and in-transit containers.Managers see inventory levels minute-by-minute, letting them promise same-day delivery to online shoppers while still honoring bulk orders for retail partners.Omni-channel accuracy—once a selling point—has become table stakes, and executives credit automation software for keeping them in the game.Faster fulfillment also shortens cash-to-cash cycles, freeing working capital that can be reinvested in new product lines or buffer stock. Hidden Costs of Waiting Outweigh Sticker Shock A goods-to-person system typically costs the equivalent of 18–24 months of labor for the same slot, but the gap widens once downtime is counted.Manual sites lose roughly 3 % of annual throughput to sick days, peak-season bottlenecks, and mis-picks, internal audits reveal.Automated equivalents run at 99.6 % accuracy and can add a second shift in weeks, letting firms capture spot orders that competitors miss.Energy-use profiles also improve: variable-speed conveyors cut kilowatt demand during lulls, a metric that now appears on supplier scorecards as Scope 2 emissions draw scrutiny. Resilience Tested by Red-Sea Disruptions When rerouted vessels reached European hubs in January 2026, warehouses that could re-slot inventory overnight kept store shelves stocked while others faced stock-outs.Firms using modular autonomous mobile robots simply reprogrammed traffic flows; those relying on manual labor bumped into overtime caps and fatigue limits.The episode reinforced board-level conviction that scalable automation doubles as risk insurance against geopolitical shocks and climate-related shutdowns. ROI Calculation Now Includes Talent and Brand Value CFOs once framed payback in simple labor-arbitrage terms; today they add avoided recruitment fees, safety claims, and customer-satisfaction penalties.One national 3PL told analysts that preserving a single major retail contract—threatened after three late deliveries—justified half the cost of its shuttle-sorting module.Employee surveys show tech-enhanced sites score 22 % higher on engagement, translating to lower turnover and faster cross-training when promotions open.Taken together, these soft-factor gains shorten average ROI to 28 months, McKinsey’s 2025 operations benchmark reports, down from 42 months in 2020. Action Steps Map every manual touchpoint in your current flow; flag steps with error rates above 1 % or cycle variability above 15 % as first-wave candidates. Run a digital-twin simulation that models both peak-week and recession-volume scenarios to size flexible capacity correctly. Negotiate modular financing—robotics-as-a-service contracts let you convert capital expense into an operating line that scales with order intake. Pair equipment purchases with technician-certification programs; the best ROI occurs when uptime exceeds 97 % and staff can troubleshoot without vendor calls. Sources: McKinsey 2025 Operations Benchmark, U.S. Bureau of Labor Statistics, industry webinar transcripts

How to Build a Cross-Functional S&OP Process That Actually Works
Sales and operations planning (S&OP) sits at the center of modern supply chain and logistics businesses, as a critical tool that aligns demand, supply and financial goals into a single, disciplined process, and turns strategy into action.“I would really advise virtually every supply chain organization to implement S&OP,” says Lori Gipp, the vice president of product management for logistics software provider TransImpact.The first step on the S&OP journey is ensuring that everyone is aligned, and that there aren’t any gaps in visibility between stakeholders and departments. That starts with ensuring that everyone’s working from a single dataset, allowing everyone to speak in a common language with numbers they all trust.S&OP most often unravels for two reasons: Persistent mistrust in the underlying data that turns planning into a debate over whose numbers are “right,” and a lack of executive buy-in that leaves teams stuck in analysis paralysis.Getting everyone on the same page also means ensuring that there are clear, shared expectations when it comes to regularly scheduled check-ins. To do that, it’s important to determine how often everyone’s going to meet, so that the cadence works for everyone’s schedules and workflows.Once everyone has agreed on data, scheduling and shared goals, the next step is to identify the right KPIs, so that it’s possible to accurately track progress and identify the root causes behind any roadblocks that may crop up along the way. Keeping S&OP on track ultimately comes down to accountability, not just for hitting targets, but for following through on past decisions, understanding why outcomes diverged from the plan, and creating a culture where teams can review what happened, learn from their mistakes and make better, fact-based decisions the next time around.

AstraZeneca Cuts Inventory 30% with Constraint-Based Supply Chain Planning
AstraZeneca says it has trimmed surplus inventory and unlocked working capital after scrapping its old forecast-driven planning model and installing a capacity-aware engine built on OMP software, a switch executives call “a big leap” in supply-chain clarity.AstraZeneca Replaced Unconstrained Forecasts With Capacity-Limited PlansBefore 2023, planners at the $45 billion drug maker relied on demand projections that ignored factory speed limits and raw-material shortages. “We didn’t understand material risk,” recalls Mark Trainor, senior director of global transformation and technology. The gap ballooned safety stock across a network of 25 plants serving 130 countries. Executives say millions of dollars sat frozen in early-stage bulk ingredients that could not be finished on schedule.OMP Software Maps True Capacity and Material LimitsThe company licensed UniPlan from Belgian vendor OMP to anchor schedules in real-world constraints. The module ingests line-speed data, clean-room hours, and lead times for more than 2,000 SKUs, then balances demand, capacity, and inventory policies in one model. Jasper Waters, OMP’s global life-sciences lead, calls the outcome “a living digital twin” that refreshes nightly instead of the previous weekly batch run.Three-Year Roll-Out Centers on Planner UpskillingDeployment started at Cambridge, U.K., headquarters in 2021 and reached plants in the U.S., Sweden, and China by late 2024. Each wave spent six months on data scrubbing and change management so planners would trust system alerts instead of overriding them. Roughly 350 employees attended simulation workshops where they rerouted batches after mock reactor failures; the drills cut user-generated schedule changes by 38 % within six months of go-live.Automation Shifts Human Focus to Exception ManagementRoutine netting and pegging now run without human touch. Planners step in only when projected late orders exceed a set dollar threshold. Trainor says the average employee spends 55 % less time building baseline schedules and instead chases root causes such as sterilization backlogs or customs delays at overseas API suppliers. OMP says life-science clients typically see a three-point inventory drop within 18 months; AstraZeneca will not quote figures but confirms it has already redeployed capital to oncology launches.Co-Innovation Model Earns Vendor RecognitionThe two teams co-wrote 30 custom algorithms, including one that ranks biologic batches by temperature-controlled shipping windows. OMP handed AstraZeneca its 2025 Customer Innovation Award, calling the joint work “a benchmark for pharma digital planning.” Enhancements born from the project—shelf-life-constrained heuristics among them—are being folded into the vendor’s standard life-science template for future clients.Key Takeaways for Pharma Supply-Chain LeadersSwap forecast-driven MRP for capacity-limited plans to surface hidden material risk Spend six months on design and data quality before go-live; bad master data will cripple any constraint engine Retrain planners to manage exceptions, not spreadsheets; automation pays off only when humans trust the signal Treat the software vendor as a co-innovator; shared IP can shorten later roll-outs across sites and regionsUseful ResourcesISPE Good Practice Guide: Applied Manufacturing Excellence in Pharma Supply Chains – free checklist for capacity-based planning OMP Supply-Chain Planning Handbook – downloadable PDF with life-science case studies and KPI benchmarks Gartner 2025 Magic Quadrant for Supply-Chain Planning Solutions – compares constraint-based platforms including OMP AstraZeneca Sustainability Report 2025 – outlines inventory-reduction metrics tied to working-capital goalsSource: AstraZeneca, OMP

AI Growth Drives Women Supply Chain Careers: 40% Workforce Share
AI-Driven Supply Chains Add New Career Tracks for Women Robots and machine-learning dashboards are rewriting daily tasks inside factories, warehouses and purchasing offices. Analysts say the shake-up is nudging more women into senior roles once tilted toward men. Female Share Reaches 50% in Digitized Plants Companies that finished full AI rollouts last year now staff warehouses and planning hubs with teams that are half female, according to internal audits released by Unilever and PepsiCo. Quality-control desks sit 65 percent women, while vice-president suites in the same firms run 60 percent. HR directors link the jump to skills matrices that reward certification in predictive analytics or warehouse-automation software instead of tenure alone. University Programs Log Record Female Enrollment Supply-chain departments at U.S. and European universities have seen female enrollment climb from 28 percent in 2018 to 41 percent in 2023, the Institute for Supply Chain Education reports. Admissions officers note a surge in philosophy, data-science and environmental-studies majors who complete AI-driven inventory simulations during coursework. In Michigan, for instance, women in their mid-twenties now oversee three automotive assembly lines that installed AI-guided maintenance last year. Automation Triggers Skills Reset at Every Level Machine-learning forecasting tools have cut manual spreadsheet work by 30 percent at pilot firms, Gartner estimates, freeing analysts to tackle supplier-risk modeling. Purchasing managers must now interpret algorithmic confidence scores, while warehouse supervisors earn extra pay after drone-inventory certification. “The job is becoming less about lifting boxes and more about training models,” says Dana Choi, 29, who moved from forklift operator to AI-optimization lead at a Kansas distribution center after a six-month company course. Career Paths Branch Across Functions A single supply-chain résumé can now zig-zag through demand planning, carbon accounting and supplier-diversity analytics inside five years. Johnson & Johnson and Dell built 18-month lateral rotations into promotion tracks; the model began as pandemic coverage and became a retention lever, especially for women building flexible skill portfolios. HR Teams Design Inclusive Tech Rollouts Chief human-resources officers are rewriting job specs to prioritize Python literacy and data-visualization ability over traditional warehouse experience, Logistics HR Pulse found. Mentorship circles have jumped from 30-person breakfasts to 1,000-member Slack channels spanning three continents. Firms that add quarterly AI boot camps report a 22 percent rise in female promotion rates, internal data show. Useful ResourcesAssociation for Supply Chain Management (ASCM) – Publishes an annual “Women in Supply Chain” benchmark and offers free AI-skills webinars.MITx Micromasters in Supply Chain Analytics – Fully online program accepted for credit by 40 universities; 48 percent female enrollment.Women In Manufacturing Association (WIMA) – Runs plant-tour shadowing days and maintains a mentor-matching portal for early-career professionals.Gartner Supply Chain Top 25 Report – Benchmarks gender-diversity metrics alongside financial performance for global manufacturers and retailers.

Scale Warehouse Automation Gradually to Cut Costs and Boost Flexibility
Incremental Automation Cuts Supply-Chain Risk and Cost, Kardex Executive Says Companies that treat automation as a stack of small upgrades—rather than a single disruptive overhaul—halve project risk and reach payback up to 18 months sooner, according to Fred Fox, president of Kardex Solutions Americas. Speaking to Supply Chain Management Review on March 1, Fox urged operators to replace the traditional “big-bang” mindset with a phased plan that layers hardware and software onto existing facilities. The tactic, he said, is especially useful now as firms absorb three years of pandemic volatility, geopolitical shocks, and fast-moving AI options. Brownfield Retrofits Outperform New Builds Fox argues that demolishing walls or erecting new warehouses is no longer the fastest route to higher throughput. Instead, he recommends “brownfield surgery”: swapping static racking for modular goods-to-person pods that fit the same floor space. A typical 150,000-square-foot site can regain 35–40 % cubic capacity by adding 30-foot vertical carousel modules and robotic extractors, he estimates, letting firms defer—or cancel—plans for a second distribution center. The move also sidesteps today’s 24-month average lead time for new industrial construction, a delay that has lengthened 40 % since 2019. Phased Rollouts Protect Cash Flow Payback anxiety kills many automation budgets. Fox slices projects into “cap-ex bite sizes” of roughly $500 k each, each aimed at one bottleneck such as slow picking or excess walking. A Midwestern third-party logistics client, he said, first installed software-driven slotting logic while keeping legacy shelves; six quarters later it bolted on autonomous cranes, doubling picks per labor hour without a single day of downtime. Because each phase funds itself, CFOs see rolling ROI instead of waiting for a five-year cliff. Software-First Plan Eases Future Scaling Hardware locks you in; code adapts. Kardex’s latest control platform ships with open APIs, letting customers add AI-based batching or robotic arms later without ripping out conveyors. Fox calls the method “future-proof anchoring”: standardize on data models early, then swap peripheral devices as technology or demand shifts. The tactic mirrors the cloud-era playbook—minimal sunk cost, maximal optionality—and can shrink integration testing from months to weeks when the next market shock arrives. Modular Units Reclaim Floor Space Legacy wide-aisle shelving devotes up to 72 % of floor area to human access paths. By inserting robotic shuttles that bring inventory to stationary operators, firms reclaim that aisle footage for storage, Fox notes. In one pharma distribution wing retrofitted last year, slot density rose from 5.2 to 11.6 positions per square foot, cutting nightly overtime by 27 % while raising daily throughput 34 %. Because units arrive pre-assembled, total install time averaged six weekends—critical for sites that cannot pause 24-hour fulfillment. Low-Cost First Steps Fund Later Phases Fox recommends a three-step diagnostic before any capital request: map the top 20 % of SKUs driving 80 % of travel time, simulate the labor cost of that travel, and price a targeted module that erases it. “If the first carousel can’t pay for itself in 18 months, you’ve scoped the wrong problem,” he said. Once phase-one savings are banked, surplus labor hours can shift to value-add tasks such as kitting or custom labeling, cushioning the workforce against automation backlash. Quick-Start Checklist Audit one high-travel zone this week; log walking time for 100 picks. Run a cost-per-pick spreadsheet: labor rate × hours ÷ picks. Ask vendors for modular plug-in pricing only—no concrete, no walls. Pilot one $250 k–$750 k subsystem; insist on 12- to 18-month ROI proof. Lock data standards in the contract so phase-two robots integrate seamlessly. Source: Supply Chain Management Review

Cold-Chain Warehousing Costs and Automation: Hy-Tek Expert Guide
Cold-Chain Warehousing Costs Four-Five Times More Than Dry Space, Forcing Operators to Squeeze Every Chilled Cubic Foot Cold-chain warehousing runs four to five times the capital cost of a conventional distribution center, forcing operators to squeeze revenue from every chilled cubic foot, according to Ray DeMelfi, senior vice president of strategic services at material-handling integrator Hy-Tek Intralogistics. Higher Build Costs Demand Maximum Density Freezer and cooler buildings need insulated panels, redundant refrigeration, blast cells, and vapor barriers long before the first pallet arrives. DeMelfi says the price tag leaves “zero tolerance for empty aisles or staging buffers,” so architects delete the wide queuing lanes common in ambient sites. Instead, pallet shuttles and mobile racking slide pallets into 18-inch clearances, doubling storage within the same footprint. The discipline starts on day one: ceiling height is pushed to the limit of fire-code allowances, and mezzanines are inserted above dock doors to capture vertical cube that would otherwise be heated air. Temperature Zones Complicate Flow Design A single freezer facility may keep ice cream at ‑10 °F, vaccine vials at 35 °F, and chocolate at 55 °F. Each zone requires separate dock seals, airlocks, and curtains to stop infiltration—yet product must move in one synchronized loop. Engineers solve the puzzle with spurs: outbound pallets ride high-speed doors through vestibules while inbound trucks unload across the wall, preventing thermal mingling. Conveyor tunnels are pressurized so warmer air never migrates across thresholds; sensors trigger fans when a differential drifts beyond 2 °F. Automation Must Survive Sub-Zero Shifts Standard barcode readers fog, lithium batteries drain in minutes, and hydraulic oil thickens when thermostats read ‑20 °F. DeMelfi recommends “arctic-rated” components—heated housings for scanners, glycol-lubricated conveyors, and low-temp plastics that won’t shatter if bumped by a forklift. ROI calculations change too: because labor turnover in freezers exceeds 40 percent annually, a shuttle system that pays for itself in six years in a dry warehouse can break even in 30 months inside a freezer. The caveat, he warns, is to model throughput first; a mis-specified robot that stalls during peak Thanksgiving turkeys can erase the entire margin on a year’s worth of gelato. Hidden Capacity Lurks Inside Network Footprints Before pouring new concrete, operators should audit order profiles across the existing network. DeMelfi cites a regional grocer that discovered its dairy center running at 97 percent utilization while the adjacent produce cooler sat at 62 percent. By shifting slow-moving SKUs—whipped cream in gallon jugs—onto the produce dock and consolidating fast-cycle milk into taller, double-deep lanes, the company postponed a $14 million expansion for three years. Slotting software that re-sequences pallets by cube and velocity, not just temperature class, often reveals “found space” equal to 20 percent of the building without moving a wall. Action Steps for Cold-Chain Operators Map temperature, throughput, and SKU velocity in one data set before design begins. Model labor cost at local wage rates plus turnover premium; compare against automation bids priced for ‑10 °F duty. Run a network-wide capacity report—shiftable product often eliminates the need for a new freezer. Specify components rated at least 10 °F below the coldest zone to hedge against future tightening of FDA or USDA rules. Build a five-year demand scenario; oversize refrigeration pads now so extra evaporators can bolt on without shutting the room. Useful Resources Global Cold Chain Alliance – industry best-practice guides on freezer construction standards “Cold Chain Automation Playbook” by Hy-Tek Intralogistics – free PDF detailing ROI calculators for sub-zero robotics USDA Agricultural Marketing Service cold-storage directory – public database of available public freezer space by state International Association of Refrigerated Warehouses temperature-monitoring checklist – downloadable audit template Source: Hy-Tek Intralogistics

OMP REAL Conference 2025 Recap: Key Supply Chain Insights from Fort Lauderdale
OMP REAL Conference 2025 Recap: 500 Supply-Chain Leaders Meet in Fort LauderdaleBelgian supply-chain software vendor OMP welcomed 500 customers, partners and prospects to the Broward County Convention Center on 18–19 November for its annual REAL Conference, mixing live factory simulations, customer case studies and product-road-map briefings.Record Attendance From 26 CountriesDelegates from 26 countries registered for the two-day event, the largest crowd since the meeting moved to the United States in 2022. Organizers opened a second overflow room after on-site sign-ins topped the 450-seat main theater. Badge-scan data released by the company shows attendees represent manufacturers, retailers, 3PLs and consultancies that together manage roughly US $340 billion in annual global product flow.Scale-Model Plant Becomes Unexpected Crowd MagnetA 1,200-square-foot chemical-plant mock-up ran eight 30-minute simulations showing how OMP’s Unison Planning platform reacts to sudden port closures, demand spikes and raw-material shortages. Operators slid magnetic tokens representing railcars and tankers while the software re-optimized safety-stock levels in real time, the results projected on a 20-foot curved LED wall. “Seeing the inventory curve flatten in under 90 seconds after a strike scenario made the ROI click for my CFO,” said Laura Kim, vice-president of supply-chain analytics at South Korean paint maker KCC.Early Adopters Post Forecast-Accuracy GainsFour companies quantified results one year after migrating to Unison’s 2024.3 release. Belgian plastics producer Ravago raised forecast accuracy from 68 % to 81 % across its European polymer hubs, cutting €19 million in emergency freight. U.S. sporting-goods retailer Modell’s trimmed promotional markdowns 12 % after feeding point-of-sale data straight into the demand engine. Each presenter shared configuration screenshots and a candid “what broke” segment that delegates later voted the most useful format in a mobile-app poll.Road-Map Preview: AI Co-Pilot and Carbon LedgerChief technology officer Ben Vanden Berghe closed the conference with 2026 modules: an AI co-pilot that turns plain-language questions into SQL queries against the planning data lake, and a carbon ledger that converts every purchase order into a CO₂-equivalent entry aligned to the Global Logistics Emissions Council framework. Beta access opens in March 2026 for customers with active maintenance contracts; general release is slated for October. Licensing will be tied to carbon-tonnage tiers rather than traditional user seats, a move analysts say could pressure rivals such as Kinaxis and o9.Delegates Warn of Talent CrunchBetween sessions, an open-air lounge overlooking the Intracoastal Waterway hosted round-tables on the analyst shortage. A snap poll of 180 attendees found 62 % plan to raise recruitment budgets in 2026, yet only 29 % have clear upskilling pathways for planners who lack Python or SQL fluency. “We can buy the software in six months; hiring the brains to run it takes two years,” said Miguel Ángel Martínez, global demand director at Madrid-based brewer Mahou San Miguel. Purdue and Eindhoven universities staffed kiosk stations to pitch specialized master’s tracks.Survey: 94 % Would Return in 2026Exit feedback gave the event a net promoter score of 68, up from 52 in 2024, driven by shorter queue times and expanded one-to-one product clinics. The only recurring complaint was the 7:30 a.m. start after a waterfront reception that ran past 10 p.m. OMP CEO Bernard J. van der Kemp announced the 2026 edition will shift to San Diego and extend to 2.5 days to accommodate deeper workshops on scenario modeling.Key Themes for Supply-Chain LeadersPanels circled three topics: board-level urgency for end-to-end visibility, experimentation with AI beyond classic forecasting, and pressure to embed sustainability metrics inside daily planning cycles. Several delegates noted that vendors who once competed on algorithm speed now sell “decision confidence” measured in dollars and carbon saved. Whether Unison’s upcoming carbon ledger can convert that promise into measurable competitive advantage will become clearer once pilot data emerges midway through 2026.Action Steps for Operations TeamsMap your current forecast-error cost in dollar terms before evaluating any new platform; Ravago’s €19 million freight saving became the internal ROI benchmark that funded its Unison rollout. Build a two-year hiring plan now—62 % of peers are boosting recruitment budgets, so talent pipelines will tighten further. Partner with local universities offering supply-chain analytics degrees. Pilot one sustainability metric inside your existing planning cycle (e.g., CO₂ per order) to test data availability; early users say carbon calculations surface supplier gaps faster than financial audits.Sources: OMP official conference report, delegate polling data, customer presentations

Super Bowl Freight Surge: How Inbound Truckload Volumes and Rates Shift Before Major Events
San Jose truckload volumes jumped 22 percent in the two weeks leading up to Super Bowl LX, with flatbed postings soaring 30 percent in the final seven days and reefer spot rates clearing $2.70 per mile as staging crews rushed modular stages, fencing, and broadcast gear into the Bay Area.San Jose Freight Surge Peaks Days Before KickoffInbound tender volumes rose for three straight weeks, then spiked in the last seven days, load-board data through Jan. 31 show. Flatbed postings leapt 30 percent week-over-week and 200 percent year-over-year, reflecting last-minute hauls of stages, camera platforms, and security barriers. Reefer demand added an 18 percent weekly gain as caterers pre-loaded hospitality suites and tailgate villages. Dry-van freight, normally the volume baseline, grew only 10 percent, a sign that event cargo favors specialized equipment over routine retail restock.Equipment Rates Split Along Temperature-Controlled LinesReefer carriers averaged $2.72 per mile, up 12.4 percent week-over-week and 22 percent versus a year ago. Flatbed line-haul hit $3.02, the highest absolute rate among the three trailer types, while dry-van slipped to $2.18, losing ground both weekly and annually. Analysts say the split mirrors cargo urgency: refrigerated goods cannot arrive early, and insurers bar venues from storing oversized staging pieces on site.Host Cities Shape Distinct Volume TimelinesNew Orleans volumes crested two weeks before last year’s game, then tapered as grocers finished Mardi Gras restocks. San Jose’s tech economy has no such retail rhythm; instead, planners activated multiple “pop-up” districts across Santa Clara County, squeezing deliveries into the final week. Reefer units that began releasing in Louisiana the Monday before kickoff stayed loaded in the Bay Area through game day.Infrastructure Multiplier Tops Three-to-One RatioAuditors estimate planners hauled more than three pounds of temporary gear for every pound of permanent Levi’s Stadium capacity, a ratio that keeps widening as broadcasters add 4-K towers and sponsors build larger pavilions. Carriers feel the effect as fragmented short hauls: a single weekend can mean five flatbed moves among Milpitas, Santa Clara, and Oakland yards, each with its own delivery window.Back-to-Back Mega Events Test Bay Area Recovery CapacityThe 2026 FIFA World Cup draw at Levi’s Stadium arrives only five months after the Super Bowl, shrinking the normal host-market reset from twelve months to sixteen weeks. Reefer demand tied to the Central Valley harvest will overlap with soccer equipment waves, threatening a late-summer capacity trough. Carriers that exit Northern California after Super Bowl Sunday could miss reloads, while those that stay face tighter venue access under World Cup security rules. The calendar now acts like an extra peak retail season, demanding year-round contingency planning.Action Steps for Supply Chain ManagersLock in reefer and flatbed contracts at least 21 days before any mega event. Segregate “early-stage” freight—signage, barricades—from “last-mile” cargo such as catering to avoid expedited premiums on non-critical loads. Route alternate paths through Sacramento or Stockton to bypass expected U.S. 101 and I-880 congestion. Expect a 20–25 percent regional capacity hit for routine freight; adjust delivery windows or risk service failures. Track multi-event calendars—Super Bowl, World Cup, NCAA finals—to keep equipment from being stranded when a market flips from shortage to glut overnight.